Navigation menu
Firepush has recently been updated with a brand new feature. You can now access detailed Shopify store reports and campaign recommendations to help you analyze your store’s performance and improve conversions and sales.
You’ll see these new sales reports as soon as you log into your Firepush dashboard. They’re designed to help you understand which marketing channels are working the best and are achieving the most ROI.
Here’s a breakdown of the types of Shopify store reports now available to you.
Firepush offers dedicated support and FREE consultations to find right strategy for you
Book my demo1. Audience overview
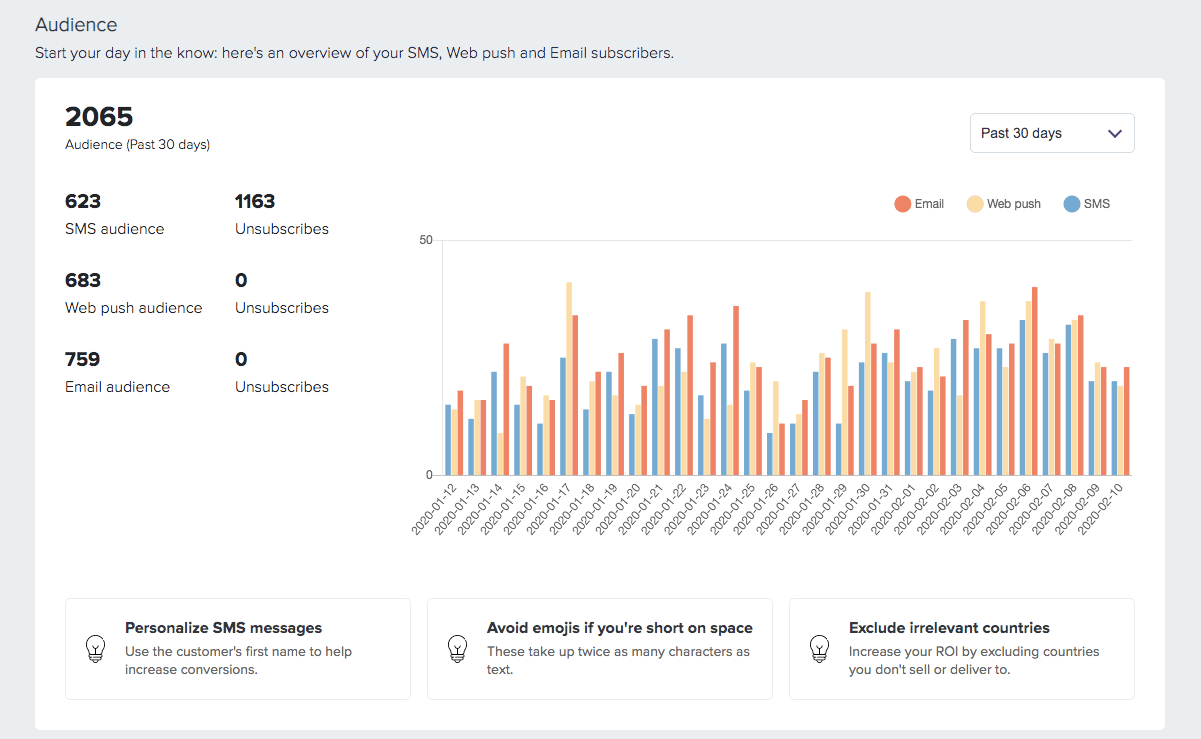
You can now see your total subscriber numbers at-a-glance, plus a breakdown of SMS, web push and email subscribers. You’ll also see how many unsubscribes you’re getting. All this information is shown by day, week or month.
At the bottom of your audience overview report, you’ll see three recommendations that you can use to improve your campaigns.
2. Store performance overview
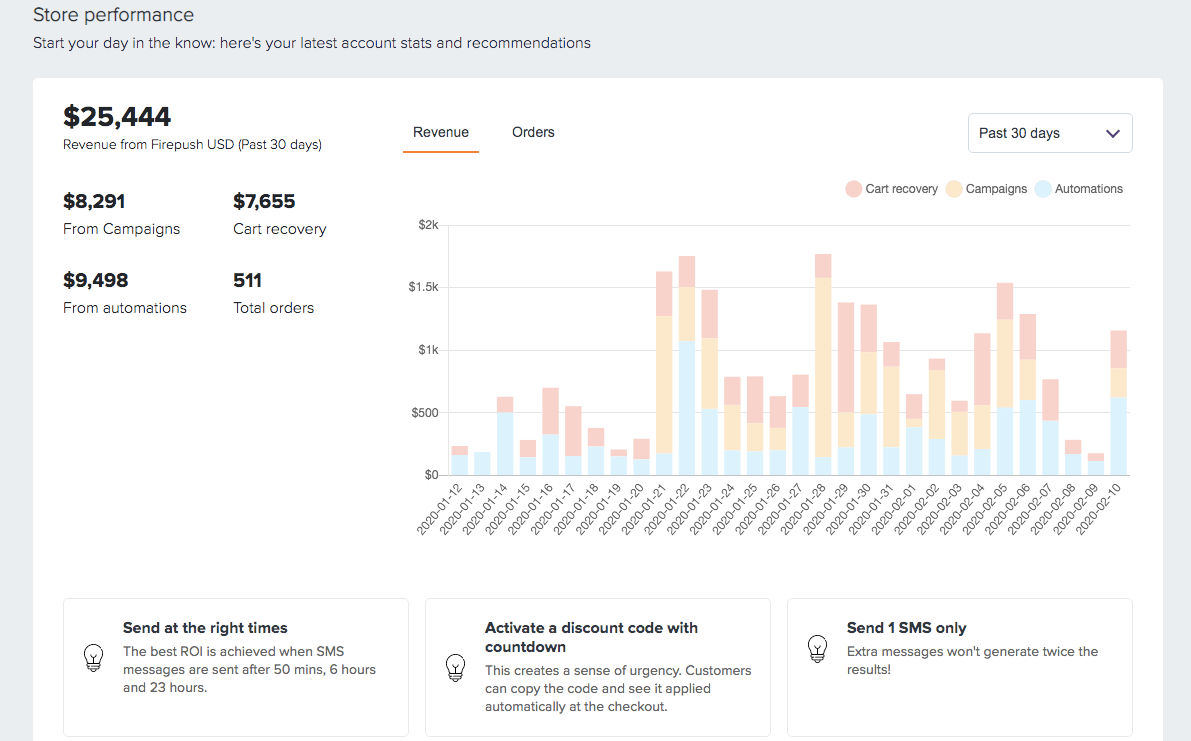
This Shopify sales report allows you to instantly see how much revenue the Firepush app has generated for you over different time periods, including the last 7 days, 30 days, 90 days and more. Within the figures shown, you’ll see a breakdown of how much revenue has come from promotional campaigns, abandoned carts and automations.
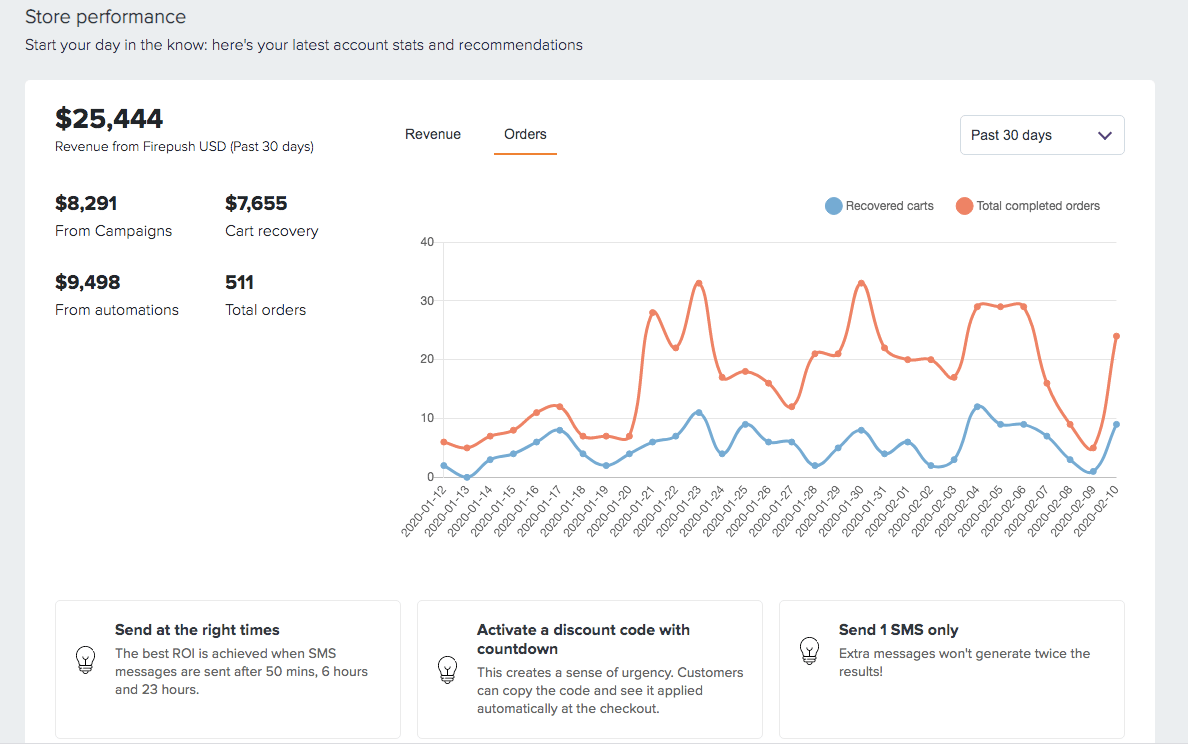
This same Shopify analytics report also gives you a different view, showing you how many orders have come from abandoned cart campaigns, plus the total number of orders received through all Firepush campaigns.
Note the three recommendations at the bottom of this report to help you boost your revenue and orders with Firepush.
3. SMS activity statistics
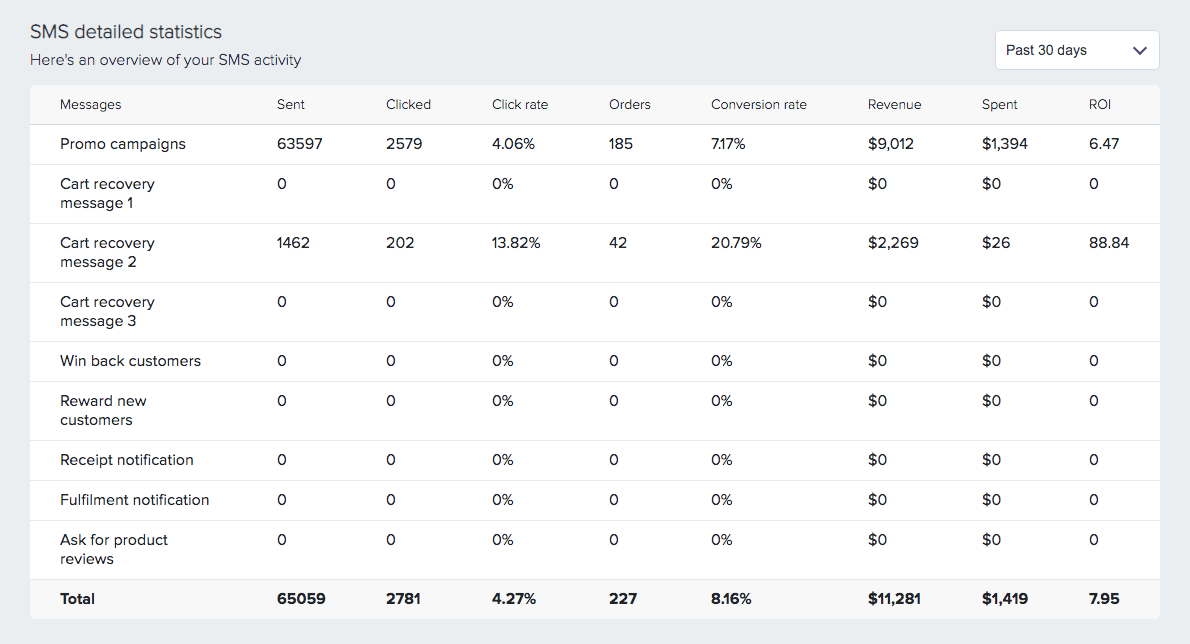
SMS campaign reporting contains useful information like how many campaigns you’ve sent, how many clicks you’ve received and your average click-through and conversion rate.
You’ll also be able to see the information that matters most - how many orders Firepush SMS campaigns are generating for you, how much revenue has been generated and how much you’ve spent. This data provides you with an average ROI.
4. Email activity statistics

This report shows the number of promotional email campaigns that you’ve sent out, plus how many clicks you’ve received. You’ll see the average click-through and conversion rate, along with how many orders and how much revenue your Firepush email campaigns have achieved. Campaign spend figures and ROI are also clearly shown.
Detailed Shopify analytics to inform future campaigns
With these new ecommerce reports, you’ll be equipped to make better strategic decisions in relation to your marketing activity. You can choose to use the marketing channels that perform the best and do more of the campaigns that generate the most results for you.
We’re constantly striving to improve Firepush to make it even more useful. This new feature is just one of the ways in which we’re doing this. You don’t necessarily need to go out looking for a separate Shopify reports app to help you understand your store’s performance metrics.
Please reach out to a member of our support team if you have any questions about these Shopify reports or your campaign recommendations.


