![60+ Fresh eCommerce Statistics & Trends [Updated 2022]](https://getfirepush.com/uploads/blog/07/14/3/firepush-blog-60ecommerce-statistics.png)
Navigation menu
Checking ecommerce statistics is a good way to stay updated on the latest developments and trends in the industry.
If you’re looking for them, you’ll get plenty of helpful ecommerce stats here. Whether you’re a business owner, marketer, or researcher, you’ll find something to improve your projects and strategies.
eCommerce Statistics: Retail Sales
Is the global retail ecommerce market recovering from the pandemic? Who are the biggest players at the moment? This section contains ecommerce stats answering these and other important questions.
1. eCommerce retail growth
eCommerce sales made up 13.6% of all sales in the U.S. in the first quarter of 2021. The monetary value of this share was estimated at more than $215 billion.
[Census.gov]
2. Global retail sales are growing
Worldwide retail sales are projected to hit $5 trillion in 2022 and $6 trillion in 2024, with around 24% of sales made online.
[Emarketer]
3. Mobile ecommerce sales are rising; customers want fast sites
50% of the global ecommerce sales were made on mobile devices; shoppers tend to abandon online stores if they load for longer than three seconds on mobile.
[Shopify]
4. China is the leader in ecommerce sales
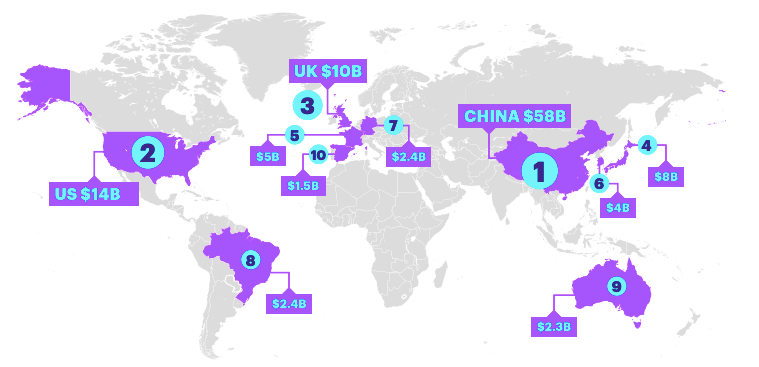
Online sales are expected to surpass $108 billion for the top 10 ecommerce markets, with China leading the pack with 66% of sales ($58 billion).
[Accenture]
5. Amazon is the biggest retail player in the U.S.
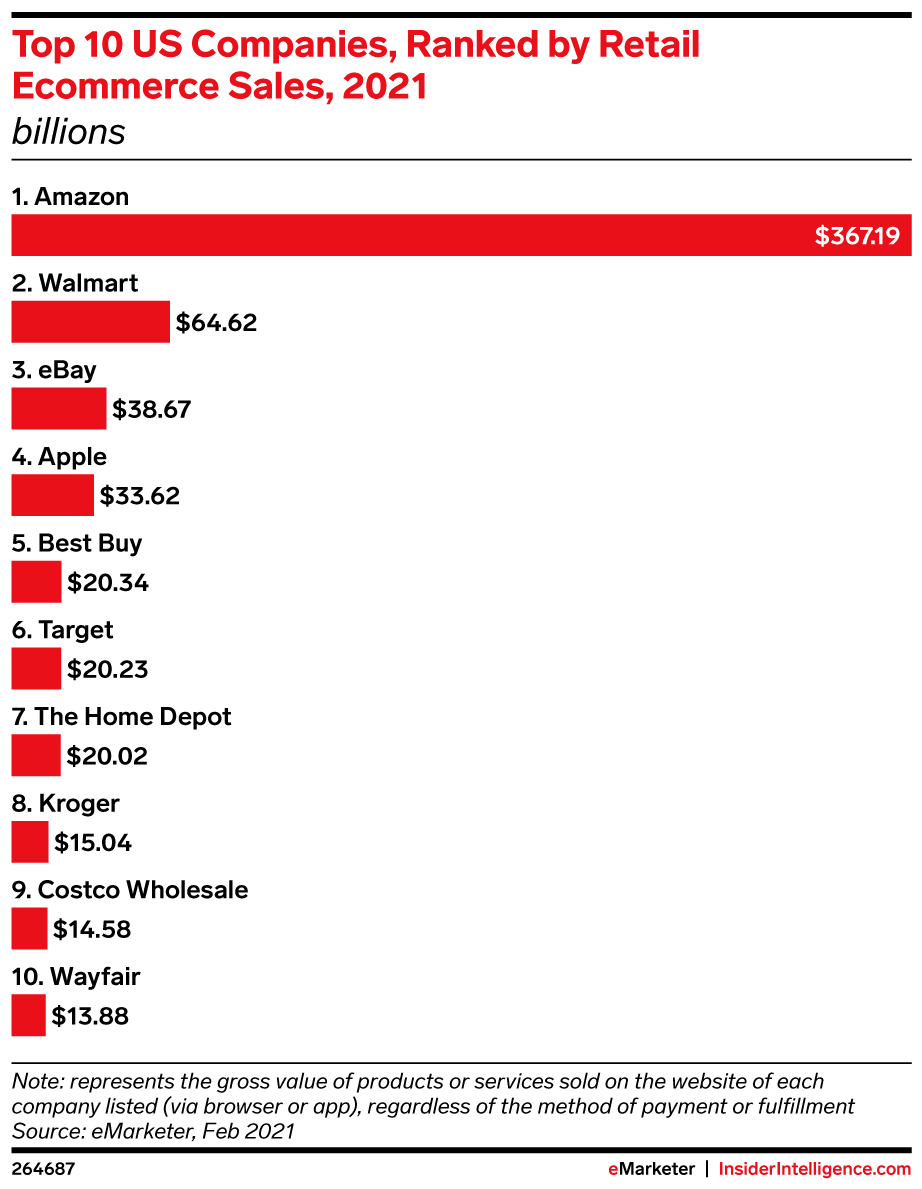
Amazon remains the world’s largest retailer in 2021 with $367.19 billion made in ecommerce sales. Walmart is the second with $64.62 billion.
[Emarketer]
6. Decade growth marks hit in three months
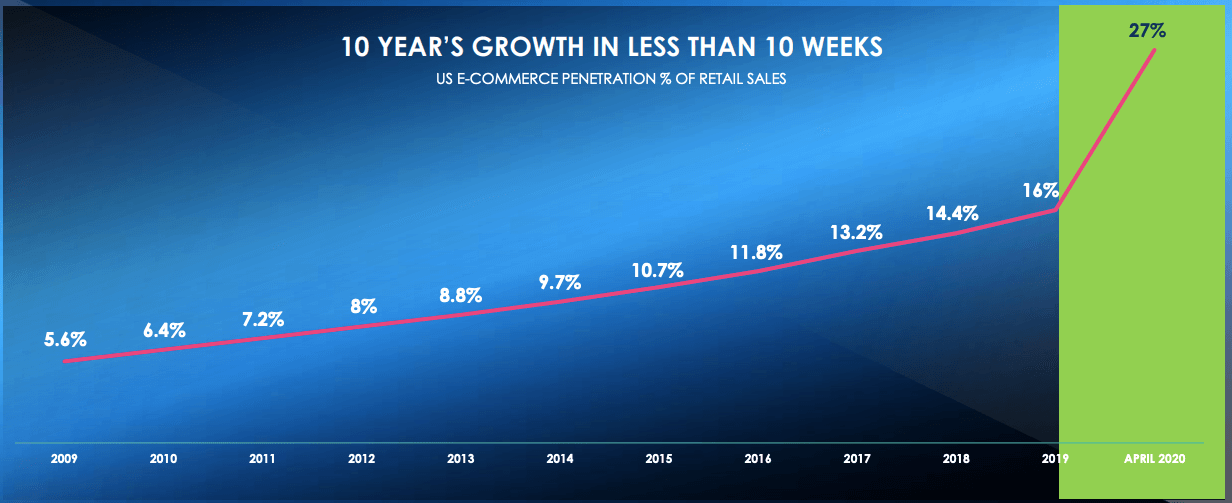
The U.S. ecommerce sales have increased by 11% between the start of the COVID-19 pandemic and April 2020. This indicator is equivalent to 10 years of pre-pandemic growth.
[Loreal]
Ivory Ella, a fashion retailer, used an omnichannel approach to remarketing and lead nurturing. The brand sent promos and updates to subscribers via push notifications, and generated $1+ million of extra revenues in several years. Details: Ivory Ella Case Study.
eCommerce Statistics: Omnichannel
Omnichannel has become an important strategy for many stores of all sizes. Check out these stats suggesting major benefits for being an omnichannel business.
7. Omnichannel shoppers pay more
Digital omnichannel customers spend over $2,000 on apparel and buy 70% more often compared to offline customers.
[Mckinsey]
8. Omnichannel is a must for online sales
65% of online shoppers engage with four or five digital marketing channels along their customer journey with a brand.
[Journal of Interactive Marketing]
9. Chatbots prove helpful
20% of online shoppers who engage with an automated support system such as a chatbot don’t need assistance from live agents.
[McKinsey]
10. User-friendly websites and apps are a must
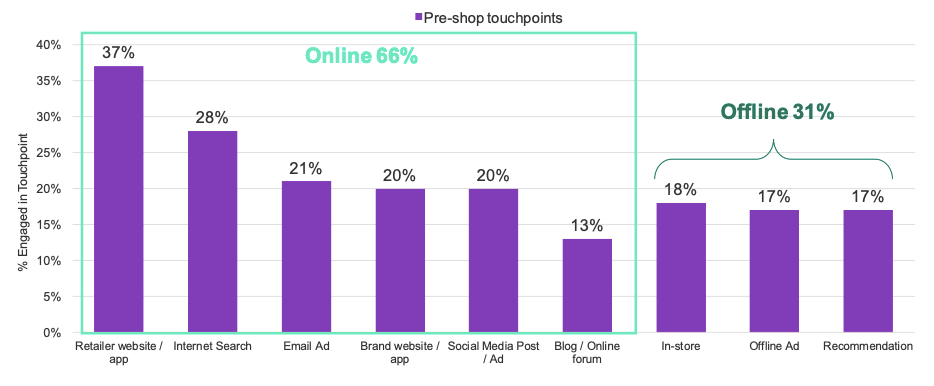
A website or app is the most common online pre-shop touchpoint for 37% of customers. Brick-and-mortar stores are the top offline touchpoint with 18%.
[Catalyst Digital]
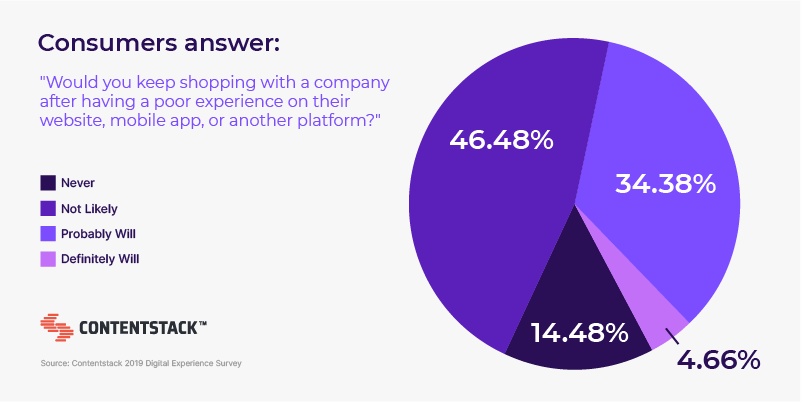
11. Poor experiences increase customer churn
Over 60% of customers are likely to stop buying from a company after a single negative experience on a website, app, or other communication channels.
[Content Stack]
This Omnichannel Marketing Definition, Strategy, Tips guide has tips to engage more omnichannel customers.
eCommerce Statistics: Online Shopping
These ecommerce stats represent changes and trends in the online shopping process. Also, we’ll look at some helpful insights for online businesses.
12. Smartphones continue to help with choosing deals
82% of smartphone users use their devices to find information that can help them make a better purchase decision.
[Think With Google]
13. Amazon is the favorite place to research products
38% of U.S.-based customers begin product searches with Amazon while 35% turn to Google. This makes Amazon the most popular destination for product research for online consumers.
[Accenture]
14. Men spend more online than women
Male and female customers shop online with the same frequency, but men tend to spend more money per transaction (US$220 vs. US$151 for women).
One reason that explains this ecommerce statistic is that men are more likely to shop for luxury goods like watches. Women, on the other hand, mostly shop for products with lower prices (cosmetics, skin care, etc.)
[KPMG International]
15. Trust reigns supreme
90% of online shoppers decide to buy a product recommended by a friend, which makes referral programs a legit digital promotion method.
[Shopify]
16. Chinese ecommerce retail is booming
China is forecasted to produce $2.779 trillion in ecommerce retail sales (65.8% of the global volume) thanks to the highest number of digital shoppers: 792.5 million (33.3% of the global digital buyers).
[Emarketer]
17. More shoppers pay via mobile
Mobile payments have increased in importance for 80% of customers. Most of them plan to continue paying via mobile after the pandemic is over.
[McKinsey]
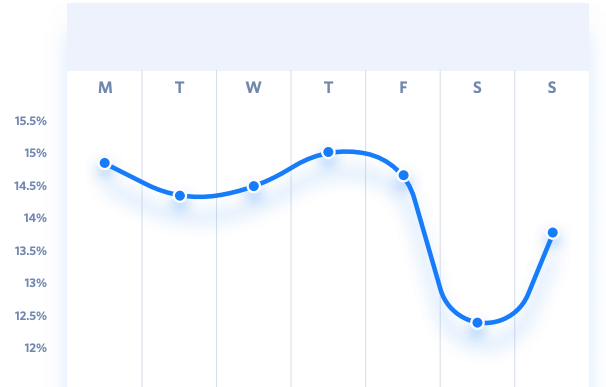
18. Tuesday is a great day for promotions
Online shoppers are more likely to buy on Thursday than any other day of the week. The difference in orders is three million compared to Saturday.
[SaleCycle]
Dedicated customer account pages help drive repeat purchases and loyalty. Here’s How to Create Customer Account Pages.
eCommerce Statistics: Abandoned Shopping Cart Recovery
This section contains ecommerce stats revealing the latest insights and figures showing customer motivations behind abandoned carts. Also, we’ll review some methods that online businesses are employing to recover sales.
19. Why customers are leaving mid-purchase
Unexpected costs and product research are two top reasons why over 50% of online customers choose to abandon shopping carts.
[Developing Digital Marketing Journal]
20. Tons of money is left on the table
Lost revenue from abandoned shopping carts in eCommerce amounted to more than $4.6 trillion in 2019.
[Journal of Marketing]
21. AI is getting good at reducing cart abandonment
A machine learning algorithm was able to predict 83.58% of abandoned shopping carts in an online store of a large German online retailer.
[International Journal of Market Research]
22. Customer-friendly checkout helps increase sales
A better checkout design that makes shopping easier and faster for consumers can increase the conversion rate by 35.26%.
[Baymard Institute]
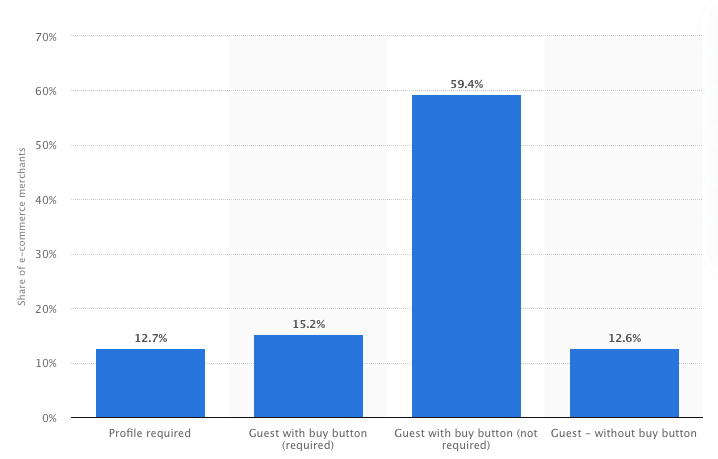
23. More ecommerce stores have guest checkouts
In 2020, only 27.9% of U.S. online merchants require shoppers to create an account to make a purchase. The rest allowed customers to buy with a guest checkout that required only the most essential information (name, shipping address, etc.)
[Statista]
Using emails to recover more sales? See these 15 Examples of Abandoned Cart Emails to get inspired.
eCommerce Statistics: Customer Behavior
Customer behavior is an individual’s buying habits and patterns. The stats below present the latest customer analysis and research findings in this area.
24. Personalize and show benefits to encourage sales
Hedonic motivation and digital marketing personalization improve customer experience and loyalty in 71% of online shoppers.
[Journal of Retailing and Consumer Services]
Note: Hedonic motivation is a tendency to escape pain and live an enjoyable life.
25. Customer reviews are still important
Positive online reviews make 94% of shoppers more likely to buy a product or use a service of the business.
[BrightLocal]
26. Promote products on social media
57% of online customers follow brands on social media to learn more about products and get updated on product news.
[Sprout Social]
27. Easy shopping = sales?
55% of customers say they stay loyal to brands because of easy shopping. That means fast registration, purchasing, omnichannel presence, and “no questions asked” return policies.
[KPMG International]
28. Customers appreciate live chat
92% of customers are satisfied with live chat as a support method. Live chat is perceived as a fast way to get service from online companies—unlike email and even phone calls.
[99Firms]
29. Online ratings impact purchase decisions
87% of customers read online reviews before considering buying products or using services from a brand. Only 48% of them would consider using a brand with a rating lower than four stars.
[BrightLocal]
30. Monetary bonuses are popular
83% of loyalty programs from businesses in the U.S. offer financial rewards to encourage customers to place more orders.
[Psychology & Marketing Journal]
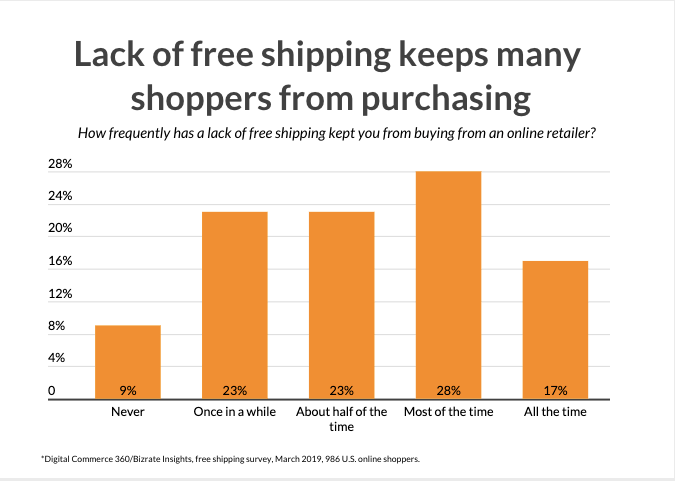
31. Offer free shipping to sell more
A lack of free shipping options prevents up to 45% of customers from buying either “most of the time” or “all the time.”
[eCommerce Guide]
32. Omnichannel customer education is important
76% of B2B buyers use three or more information channels (social media, websites, etc.) when researching a product.
[Digital Marketer’s World]
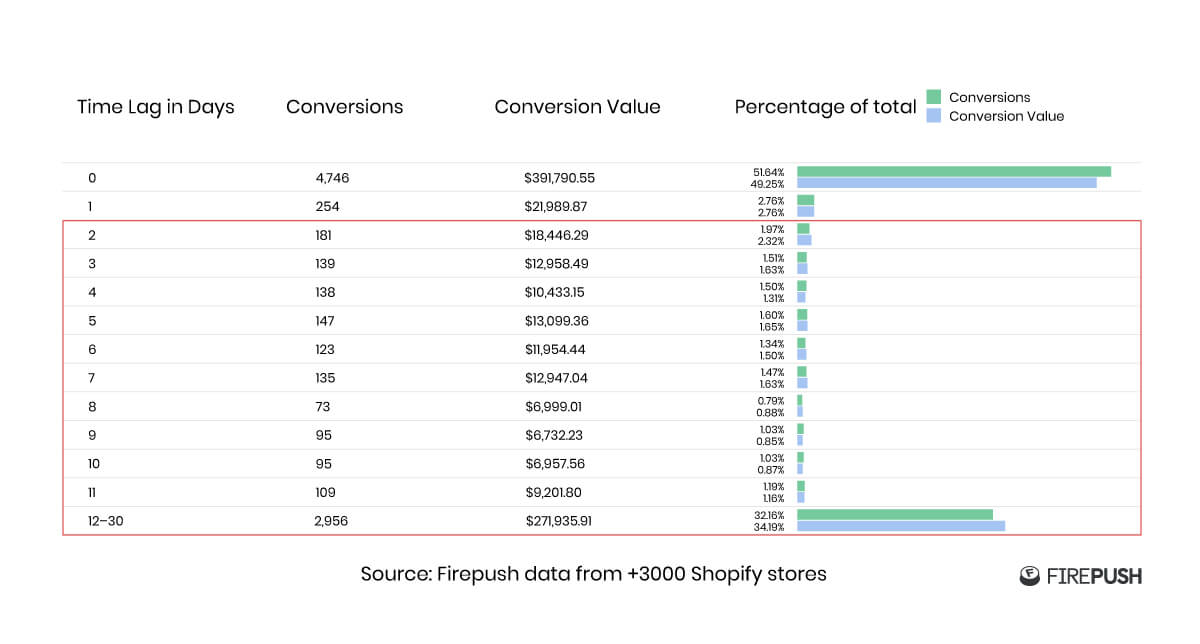
33. Continuous lead nurturing is critical for sales
32% of Shopify store visitors who subscribed to newsletters will buy only after receiving promotional content for between 12 and 30 days.
[Firepush]
Pura Vida used push notifications for lead nurturing and is making $30,000 in sales every month. Details: Pura Vida Case Study
34. Surprises encourage buying
59% of customers see surprise offers and gifts as the most important way brands could interact with them.
[Merkle]
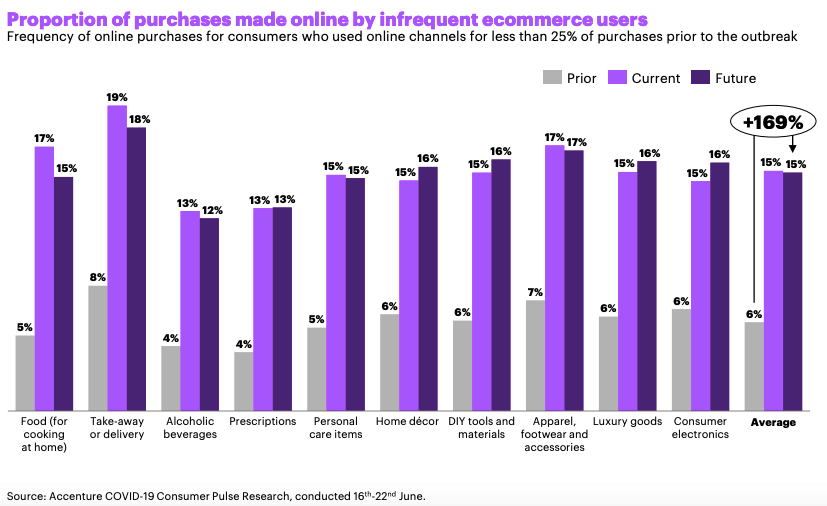
35. New ecommerce customers will continue buying online after the pandemic
Customers who don’t generally buy things online will be doing that more often after the pandemic. Research suggests that the expected future increase rate in online orders from new and low-frequency online shoppers by 169%.
[Accenture]
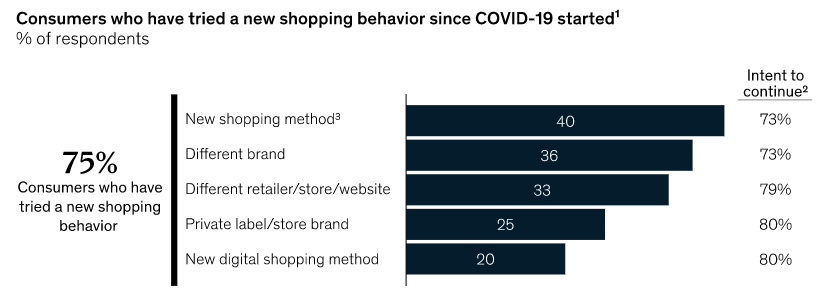
36. Pandemic changed customer behaviors
75% of customers have tried a new shopping behavior since the start of the pandemic. 36% of them even tried a new brand and intend to continue doing so.
[McKinsey]
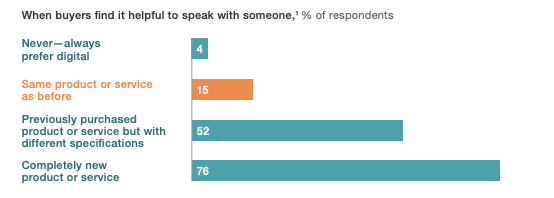
37. Most B2B customers re-convert easily
Only 15% of B2B clients need to talk to a business representative when making a repeat purchase. This percentage rises to 76% in the case they’re considering a new product or service.
[McKinsey]
Want smart strategies to generate more orders with discounts? This guide has Tips to Create Discounts for Shopify Stores to help you maximize impact of sales and promos.
eCommerce Statistics: Dropshipping
Are you planning to open a dropshipping store? Or maybe doing research on the dropshipping market? Find helpful statistics in this part.
38. Dropshipping is getting more popular
The global dropshipping market is projected to increase annually by around 29% between 2021 and 2025.
[Market Data Forecast]
39. Top reason why dropshippers fail
90% of dropshippers fail within the first few months because they don’t add any value for their customers.
[Cloudways]
40. Top dropshipping items
Handheld device accessories (Global order growth: +370.8%), household storage containers (+276.2%), and hair styling tools and accessories (+245.4%) are the top dropshipping product categories to sell in 2020.
[Shopify]
41. Dropshipping supports one-third of global online sales
At least 35% of online stores use dropshipping as the method of inventory management and distribution. The percentage means that this model supports between 33% and 40% of global ecommerce sales.
[ESIC Market Economics and Business Journal]
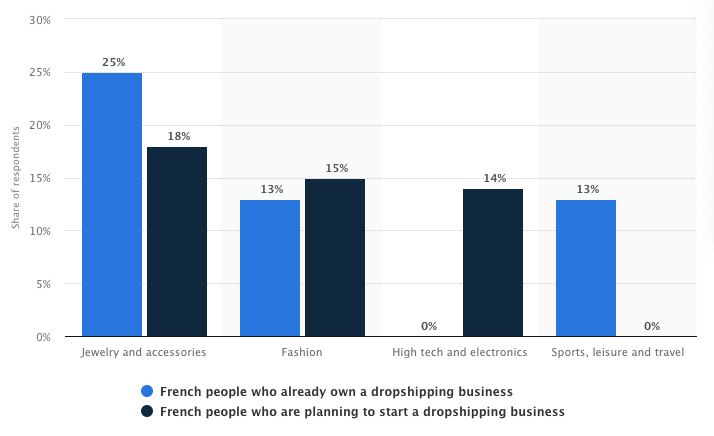
42. Top dropshipping businesses in France
Jewelry & accessories (18%), fashion (15%), and tech & electronics (14%) are the top business categories that France-based entrepreneurs choose.
[Statista]
Interested in increasing sales as a dropshipping business? This Remarketing Guide for Dropshippers has helpful tips and examples.
eCommerce Statistics: SMS Marketing
Is SMS marketing a good strategy to invest in this year? How can online retailers and small stores use text messages to engage customers? This section has useful e-commerce stats that answer these questions.
43. Many shoppers appreciate SMS promotions
54% of customers prefer to receive promotions from brands via SMS messages, but only 11% of businesses use this method.
[G2]
44. SMS marketing has high open rates
U.S.-based customers open and read 42% of the text messages they receive from businesses. European customers share a similar story: open and read rates were 45% in France, 57% in Germany, and 41% in the UK.
[McKinsey]
45. SMS coupons are popular
Online customers are 10 times more likely to use coupons from SMS in comparison to traditional coupons.
[Adobe]
46. SMS marketing campaigns generate high ROI
Proozy, an online clothing retailer, made over $30 for every $1 invested in SMS marketing. This included an 11% click-through rate and a 13% conversion rate.
[Firepush]
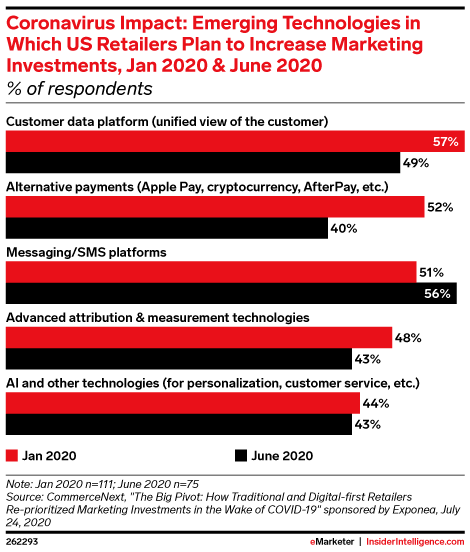
47. Pandemic accelerated adoption of text message marketing
56% of marketers planned to increase investments in SMS message marketing campaigns. This percentage represents a 4% increase since the start of the pandemic.
[Emarketer]
Want to give SMS marketing a try? This guide with the Best SMS Marketing Apps for eCommerce also has tips for beginners.
eCommerce Statistics: Social Media
Social media plays a huge role in defining online customers’ purchasing behavior. Use these stats to improve your social media marketing strategy and engage more customers.
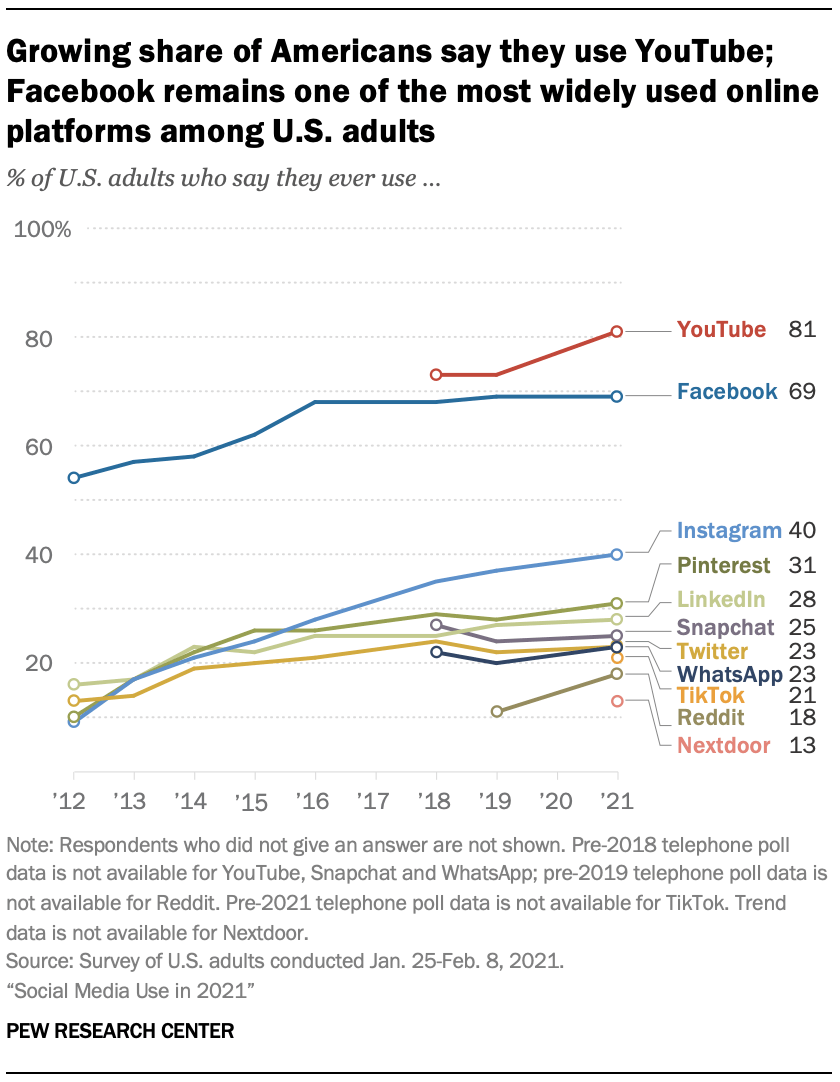
48. Americans prefer Facebook and YouTube
Facebook and YouTube are the most popular social media platforms in the U.S., used by 69% and 81% of adults, respectively.
[Pew Research Center]
49. Pinterest is popular for product research
80% of weekly Pinterest users say they discovered an interesting brand or product on the platform. Pinterest remains the best social media for non-promotional digital marketing.
[Pinterest]
50. Social media customer support helps build a reputation
54% of online shoppers had a favorable view of eCommerce brands that replied to customer support-related questions on social media.
[Microsoft]
51. Personalized products increase order values
One in five consumers who would like to try personalized clothing products is willing to pay a 20% premium. This ecommerce stat suggests that offering personalization conversion rate and loyalty.
[Deloitte]
52. Instagram is great for product discovery
81% of Instagram users say that the platform helps them research products and services on a regular basis.
[Instagram]
eCommerce Statistics: The Impact of COVID-19
This section includes ecommerce stats showing the developments, trends, and opportunities for online sellers.
53. Coupons are effective for marketing during the pandemic
Customers who live in areas that are highly affected by COVID-19 are 244% more likely to redeem a discount. This ecommerce stat suggests that discounts should be a part of digital marketing strategies to encourage customers to buy online.
[Social Science Research Network]
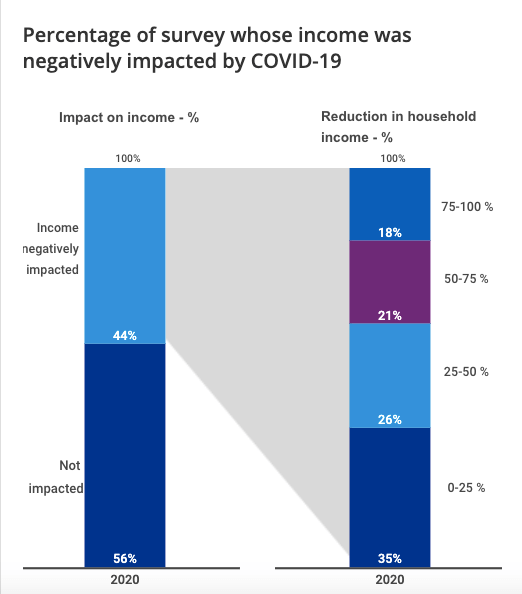
54. Many customers’ purchasing power is affected
In 2020, 44% of U.S. consumers said their income was negatively impacted by the COVID-19 pandemic. The remaining 56% claimed their earnings weren’t impacted at all.
[KPMG International]
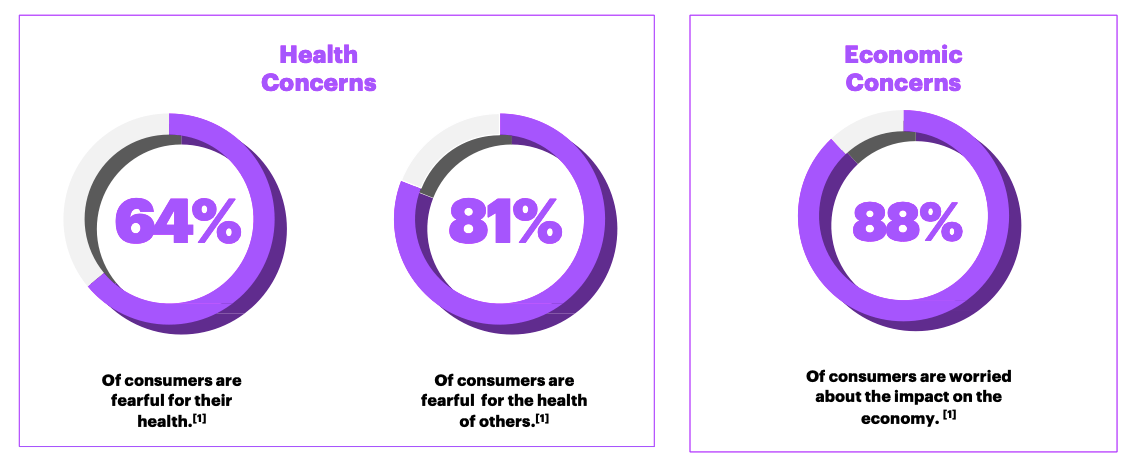
55. Customers are fearful for the economy
The impact of the pandemic on the economy is the top concern for 88% of U.S. customers, followed by health concerns.
[Accenture]
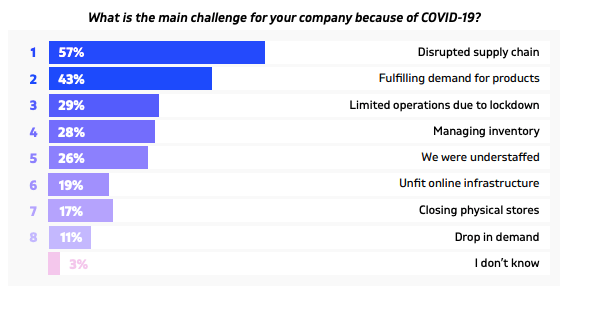
56. Top challenges brought about by the pandemic
A disrupted supply chain, fulfilling demand, and limited operations because of lockdowns were the top three challenges for 57%, 43%, and 29% of eCommerce sellers, respectively.
[SearchNode]
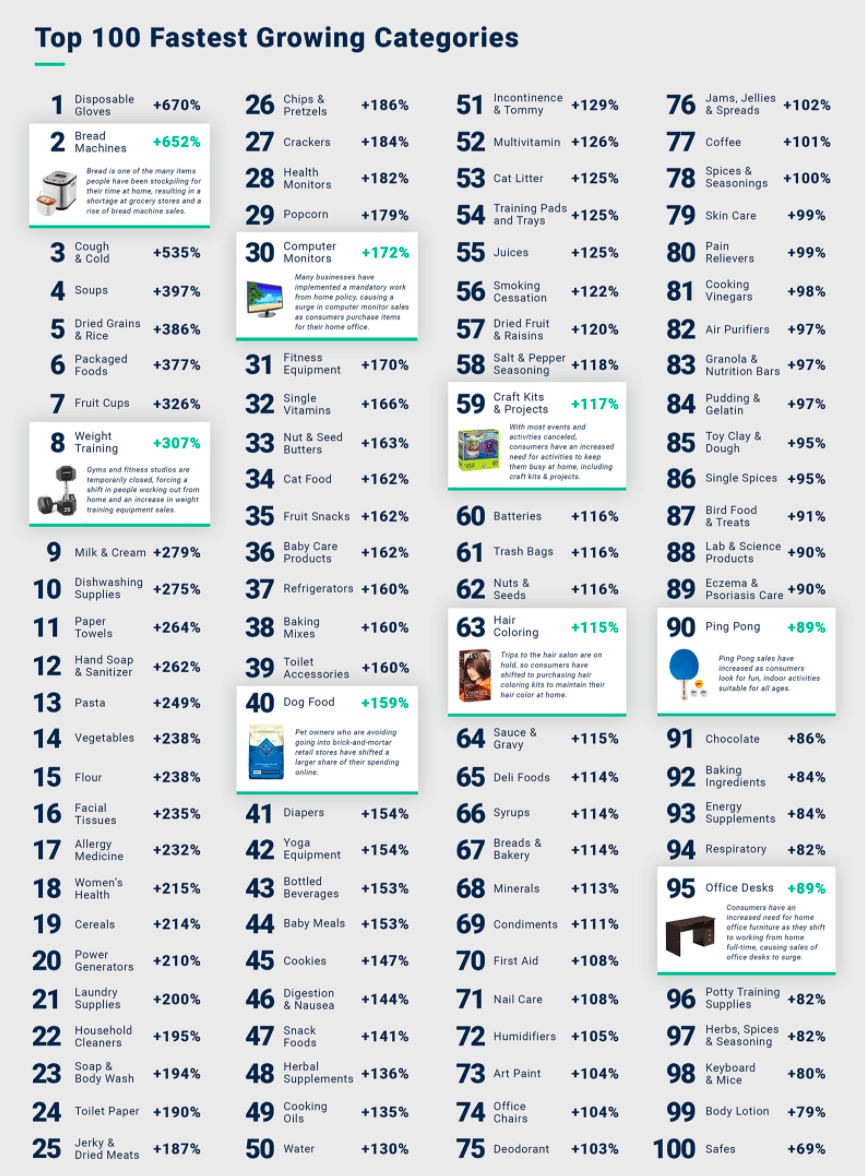
57. COVID-19 drives growth of many ecommerce categories
Disposable gloves (+670% in sales), bread machines (+652%), cough & cold products (+535%), soups (394%), and dried grains & rice (386%) were the fastest-growing ecommerce retail categories in 2020.
[Stackline]
Looking to start a new Shopify business during the pandemic? Here’s how to Set Up a Shopify Store for Local Delivery During COVID-19.
eCommerce Statistics: Trends
What’s in store for ecommerce businesses in the nearest future? Let’s see some stats suggesting important trends that could be impacting the world of digital commerce in the next few years.
58. Customers look for sustainable products
Almost 25% of European consumers are likely to change stores if they knew that the products they were buying were unsustainable.
[McKinsey]
59. Augmented reality improves customer experience
Augmented reality (AR) will become a major game changer in ecommerce that will help more customers to visualize the products they’re interested in buying. The number of AR users is expected to reach 95 million by 2022 in the U.S. alone.
[Statista]
60. Voice search might be taking off
More consumers (especially those using mobile devices) will search for products and services with voice. The growing number of smart speakers and personal assistants is one of the reasons for the trend: it’s predicted that 75% of U.S. households will have a smart speaker by 2025.
[BigCommerce]
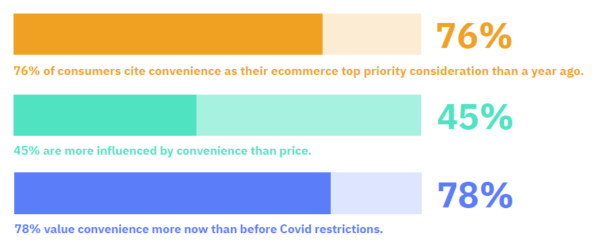
61. Price is no longer top priority for consumers
Convenience is more important than price for ecommerce shoppers, with 83% of them agreeing with this statement.
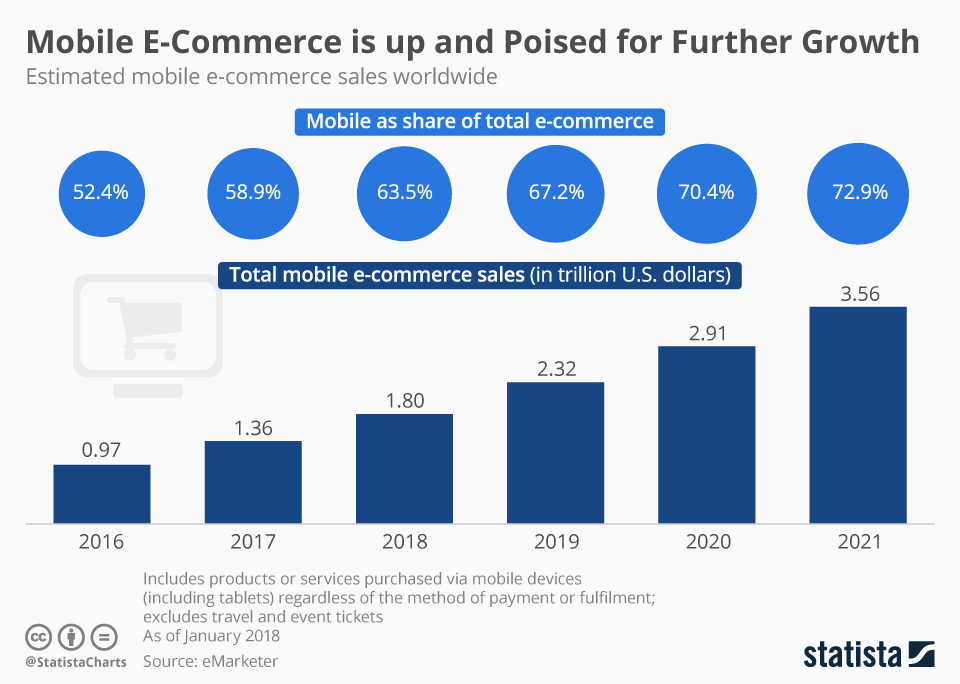
62. Mobile ecommerce is growing steadily
In 2021, mobile ecommerce (mcommerce) should generate over $3.56 billion in revenues and take up 72.9% of the entire share of ecommerce sales. This is a major increase compared to the 2020’s sales of $2.91 billion.
[Statista]
e-Commerce Statistics: Summary
These ecommerce stats show that ecommerce sales (including mobile) are poised for huge growth. With China leading the pack, the market is about to hit a new all-time mark. eCommerce merchants will also need to design effective omnichannel customer journeys to generate more sales.
If you’d like to find out more about engaging Shopify customers, feel free to browse our blog. We have in-depth guides on Shopify marketing, emails, SMS, customer retention, and other essentials for business owners.
Sources
- Census.gov
- Emarketer: Worldwide ecommerce will approach $5 trillion this year
- Shopify: The Future of Ecommerce Report 2021
- Accenture: CPG sales & eCommerce: Move to modern starts here
- Emarketer
- Loreal
- McKinsey
- Journal of Interactive Marketing
- McKinsey
- Catalyst Digital
- Content Stack
- Think With Google
- Accenture
- KPMG International
- Shopify
- Emarketer
- McKinsey
- SaleCycle
- Developing Digital Marketing Journal
- Journal of Marketing
- International Journal of Market Research
- Baymard Institute
- Statista
- Journal of Retailing and Consumer Services
- BrightLocal
- Sprout Social
- KPMG International
- 99Firms
- BrightLocal
- Psychology & Marketing Journal
- eCommerce Guide
- Digital Marketer’s World
- Firepush
- Merkle
- Accenture
- McKinsey
- McKinsey
- Market Data Forecast
- Cloudways
- Shopify
- ESIC Market Economics and Business Journal
- Statista
- G2
- McKinsey
- Adobe
- Firepush
- Emarketer
- Pew Research Center
- Microsoft
- Deloitte
- Social Science Research Network
- KPMG International
- Accenture
- SearchNode
- Stackline
- McKinsey
- Statista
- BigCommerce
- Linnworks
- Statista


